 |
|||
 |
|||
       |
|||


 |
|
News Article From: 10-12-2006Resale Listing Growth
Real-time Information
ARMLS compiles monthly data to release reports on about the 15th of each month. In this rapidly changing market, utilizing only the Arizona Regional Monthly Listing Service (ARMLS) Sales Reports has the potential of delaying the timely identification of changes in the market. You need to know what has happened since those reports were compiled to assess if there were any trends developing in late July and early August.
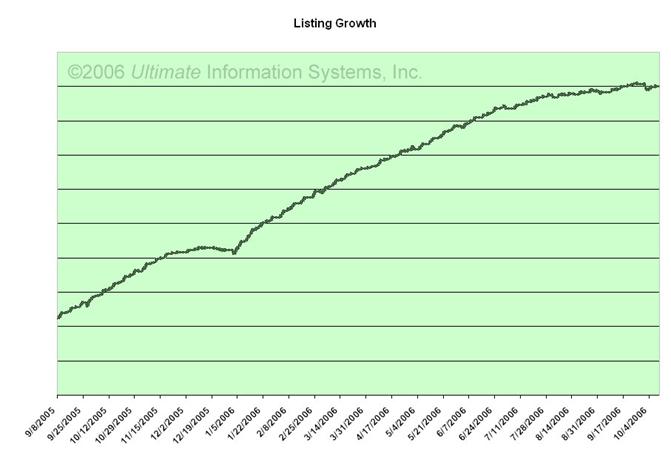
As you can see from the graph below, the listing rate has been gradually declining for the last two to three months. For the last two weeks that rate has dropped by almost 200 new listings per week. The total number of additional listings from mid-July to mid-August was about 1,000 as compared to a growth of 2,000 two months ago. The following graphs clearly illustrate a slowing climb.
Resale Listings September 8, 2005 – October 10, 2006
The graphs below and above were compiled using daily figures of Internet MLS listings. The quantities do not exactly match ARMLS Report numbers, because a few ARMLS members exclude their listings from the Internet, but the patterns of the two sources are very similar. Because the actual numbers differ slightly, these graphs have been designed to show no quantities on the vertical scale.
Resale Listing Numbers
The ten-month graph below is also based on a real-time representation of what is happening in the listing arena.
Listing Trend November 9, 2005 – October 10, 2006
Commentary
Resale listings continue to grow, but that growth rate has declined substantially. These numbers could indicate that the market may be approaching a peak in the quantity of resale listings, or they could simply indicate that sellers are taking their homes off the market to wait for a more favorable time to sell. Whatever the reason is behind the drop in listings, there is still a significant over supply of inventory, and it will take a good number of months before we see a return to a more normal market.
|
 <!--[endif]-->
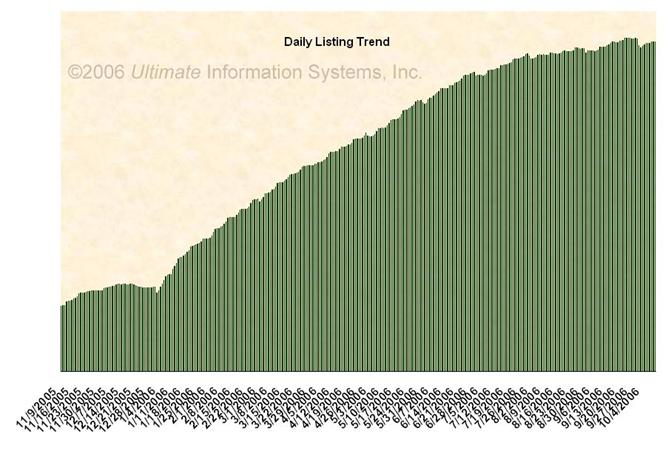 <!--[endif]-->
A CompuGor Website