 |
|||
 |
|||
       |
|||


 |
|
News Article From: 12-20-2006
November ARMLS Reports
Resale Listings
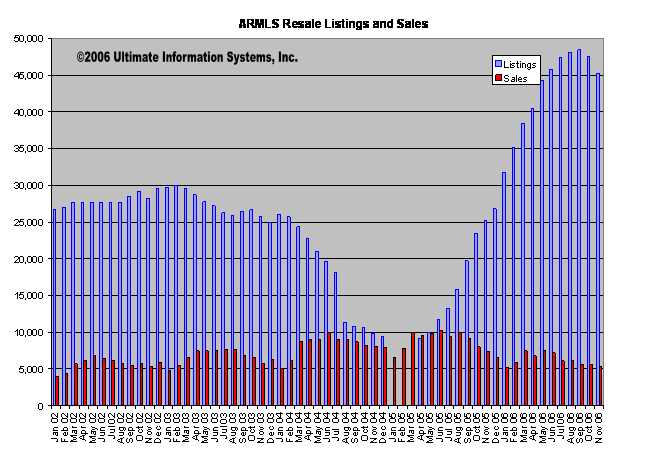
The listing count reported in the November ARMLS Reports, which were released on December 15th, was 45,261—down 2,327 listings from the October reports. October saw the first drop in listings in thirteen months, though the number still remains extremely high. The record level of listings prior to January 2005 was 30,046 listings in February 2003. The monthly listing quantity dropped almost 5% over the October report.
If your clients do not believe that the market has changed, and they expect multiple offers and selling prices exceeding the listing prices, use this information. Tell them, “Compared to twelve months ago, listings have increased by 35,442!”
Resale Sales
ARMLS-reported sales for November dropped only slightly from the October sales figure with a decrease of 249 sales. On an annually adjusted basis sales were down 2,030 or about 27% from November 2005. November sales quantity is typically very similar to those for October, so this quantity is not abnormal based upon the calendar cycle. In this normal calendar cycle, sales tend to be highest in the summer and then gradually taper off over the next few months before resuming the climb during the first quarter of each year. The winter months are consistently the lowest in sales.
Our sources of data for these displays are the ARMLS reports. In these, there are three months, January – March 2005, for which we have not shown listing data because of apparent discrepancies. Additionally, ARMLS notes that the listing information for March through August 2002 may contain errors, but we have chosen to display this reasonable data above.
Our Assessment of the Resale Market
Supply and demand are interrelated variables in the Real Estate Market, but changes in the current market are being driven almost exclusively by the supply variable. Sixteen months ago demand was the primary driver. We expect sales to continue at a pace similar to 2002 and 2003 for several months.
With the current over-supply situation, resale housing prices have started to decline and appear to be entering an ongoing downward adjustment mode. This emerging adjustment will help to realign the supply and demand variable.
Copyright® 2006 - This information is compiled and written by Ultimate Information Systems, Inc. Use of this article, in part or in its entirety, is expressly prohibited without written permission. Click here to request limited rights to reuse this information.
|
 <!--[endif]-->
A CompuGor Website