 |
|||
 |
|||
       |
|||


 |
|
News Article From: 06-14-2007New Listings Information
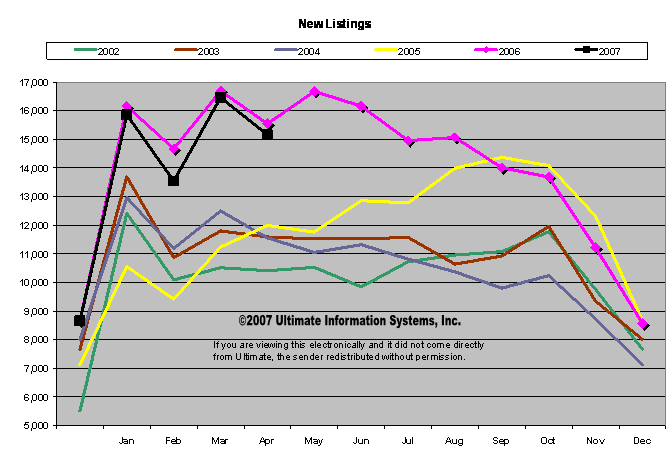
The level of the homes-for-sale inventory is one of the key pieces of information to understanding the current real estate market. The significance of the NEW Listing Information contained in this article is subtle, but important. The quantity of new listings for the last two months has jumped up into the range that we experienced in early 2006 as listings climbed to new record heights.
Historical Perspective
NEW Listings have now been above the norm for the last twenty months and continue there, even though this count for the last six months has been slightly lower than the numbers a year ago.
New listings data counts the listings that are new to the market within the past month and does not include the listings that continue on the market past the month in which they were listed in.
Commentary
This out-of-the-ordinary growth in NEW Listings has been much of the driver behind the current market situation. However, the recent (the last four months) moderation in this number may foreshadow a slight overall listing growth moderation. The above graph illustrates a change in market behavior more clearly - and earlier - than the total listing count graph in the article titled “December ARMLS Reports”. This graph also allows the reader to more clearly see the impact of the month-by-month calendar cycle.
Copyright® 2007 - This information is compiled and written by Ultimate Information Systems, Inc. Use of this article, in part or in its entirety, is expressly prohibited without written permission. Click here to request limited rights to reuse this information.
|
 <!--[endif]-->
A CompuGor Website