 |
|||
 |
|||
       |
|||


 |
|
News Article From: 11-08-20072nd Issue of November 2007
Resale Sales Pricing Analysis
The Median Price in the recently-released September ARMLS resale sales reports is $234,900, a drop of $10,100 from the August reports. The Average Price also dropped substantially, from $343,000 to $307,100. The graph below displays both the monthly Average Price and Median Price of resale homes sold in MLS from January 2002 through September 2007.
The average price is calculated by dividing the sum of the sales prices by the number of homes sold. The median price is determined by finding the price where the quantity of homes sold for less than that price is equal to the quantity of homes sold for more than that price. The median is a better indicator of the overall market. Note the similar pattern of both measures.
Patterns Emerge When the Time Period is Subdivided
When there is a change in the slope of the line for several consecutive months, it indicates a new pattern is emerging. Four such changes appear on this graph. The display below has been subdivided at each change in slope:
Segmented History
At each change in slope of the lines in the graph above, a shift in trend is indicated. We have identified five such distinct market conditions (detailed below). Slow steady growth was experienced from 2002 through 2003 and into very early 2004. Then between March 2004 and February 2005, the median home sales price increased by $40,000. In the four months after that a $60,000 increase happened during the hot market last summer. Starting in July 2005 and lasting through September the market experienced a clear shift back to a more normal appreciation rate. October 2005 was the first month in the current market condition of flat or slightly falling median home prices.
The five market conditions are defined in the following table:
The annual rate of appreciation (listed as “Annual % Gain for this Market Period” in the chart above) is graphically represented below:
Commentary
Our current real estate market is being driven by both supply and demand. Up until two years ago, demand was the primary driver (B and C). Then for the past two years supply was the primary driver (D and E). The trigger for the significant fall off in sales prices has been the drastic decrease in demand experienced during the last few months. We may have entered a sixth condition of price fall-off.
Copyright® 2007 - This information is compiled and written by Ultimate Information Systems, Inc. Use of this article, in part or in its entirety, is expressly prohibited without written permission. Click here to request limited rights to reuse this information
|
 <!--[endif]-->
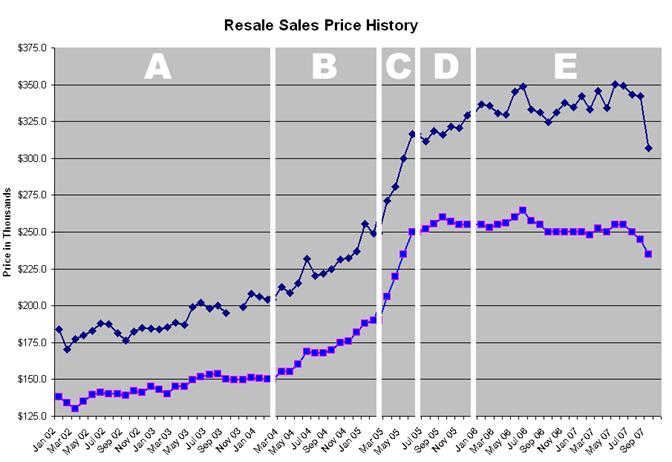 <!--[endif]-->
 <!--[endif]-->
 <!--[endif]-->
A CompuGor Website